
A cap rate calculator is a simple tool that estimates the annual return an income-producing property would generate if you bought it in cash. It takes two inputs, net operating income and property value, and returns the capitalization rate as a percentage. That single figure lets investors compare very different properties on a level footing, from a small duplex to a multi-tenant retail center, without getting lost in financing details or personal tax situations.
The underlying math is straightforward: divide net operating income by the property's price or appraised value, then multiply by one hundred. Net operating income, often shortened to NOI, is the rent and other revenue a property produces after operating expenses like property taxes, insurance, management, and maintenance, but before mortgage payments and income taxes. Because a cap rate calculator strips out debt, it isolates the performance of the asset itself rather than the performance of any particular loan structure.
Property investors reach for this number early in their screening process. When you are looking at a dozen listings, a quick cap rate helps you rank them by income yield and flag which ones deserve a deeper underwriting pass. A property with a stated cap rate that looks unusually high may carry deferred maintenance, a weak tenant, or an inflated income assumption, and one with a very low cap rate may be priced for a premium location or expected appreciation.
This guide explains how to interpret cap rates, how they differ between residential rentals and commercial assets, how buy-and-hold investors put them to work, and where the metric falls short. You will also see a worked calculation and a breakdown of what the calculator does behind the scenes. If you are weighing whether a deal can support the financing you have in mind, understanding cap rates is a practical first step before you explore how CRE loan matching works.
Key takeaways
- A cap rate calculator divides a property's net operating income by its purchase price or current value, giving investors a quick yardstick for comparing income properties.
- Higher cap rates often signal higher potential yield but also higher perceived risk, while lower cap rates typically reflect stable, lower-risk assets in strong markets.
- Cap rates ignore financing, so a leveraged buyer should also weigh debt terms, vacancy assumptions, and capital expenditures alongside the raw number.
- The same formula applies to residential rentals and commercial buildings, but the inputs and market benchmarks differ meaningfully between property types.
- Cap rate is a screening tool, not a valuation verdict; pair it with local comps, lease quality, and a realistic operating budget before committing.
How to Interpret Cap Rates in Property Investment Decisions
Reading a cap rate is less about the number itself and more about the context around it. A 6 percent cap rate on a stabilized office building in a growing metro tells a very different story than a 6 percent cap rate on an aging strip mall with a single tenant nearing lease expiration. The percentage measures current income yield, so you have to ask what assumptions produced the net operating income and how durable that income is.
As a general rule, higher cap rates imply higher expected return and higher risk, while lower cap rates reflect assets the market views as safer or positioned for appreciation. Investors often speak of markets "compressing" when strong demand pushes prices up and cap rates down. That is why a cap rate calculator is best used to compare similar properties in the same submarket rather than across regions or asset classes.
Practical interpretation also means checking whether the income is in-place or projected. A seller may quote a pro forma cap rate based on rents that assume full occupancy and above-market lease rates. Recalculate using trailing twelve-month actuals, then compare the two. The gap between in-place and pro forma tells you how much of the return depends on execution and how much you are paying for today versus tomorrow.
Cap Rate Differences Between Residential Rentals and Commercial Properties
The formula does not change between residential and commercial properties, but the inputs and benchmarks do. Small residential rentals, such as single-family homes and duplexes, are often valued using comparable sales rather than income, so their implied cap rates can look thin. Investors still calculate them to gauge cash yield, but market pricing is driven heavily by what similar homes sold for nearby.
Commercial properties, including apartment buildings above a certain unit count, retail, office, and industrial, are valued primarily on their income. Here the capitalization rate is central to how buyers and appraisers set price, because value is essentially net operating income divided by the prevailing market cap rate. A small change in that market rate can move value significantly, which is why commercial investors watch cap rate trends closely.
Operating expense treatment also differs. Residential landlords often cover more costs directly, while many commercial leases pass taxes, insurance, and maintenance to tenants through triple-net or modified-gross structures. That shifts what counts as an operating expense and therefore what NOI you plug into a cap rate calculator. When you compare a residential deal to a commercial one, confirm that both income statements are built on consistent assumptions before you trust the resulting percentages. Reviewing your target property's lease structure first prevents apples-to-oranges comparisons.
How Investors Apply Cap Rates to Buy-and-Hold Decisions
Buy-and-hold investors use cap rates at several stages of ownership, not just at purchase. At acquisition, the entry cap rate helps confirm you are paying a fair price relative to income and to comparable deals. A wider entry cap rate can create a margin of safety, because it means you are buying more current income per dollar invested.
During the hold period, investors track how their operating improvements move the cap rate implied by current value. Raising rents to market, cutting unnecessary expenses, or improving occupancy increases net operating income, which raises value at a given market cap rate. This is the core of value-add strategy: you buy at one cap rate, improve the income, and the property reprices upward even if market rates hold steady.
At exit, investors estimate a terminal or reversion cap rate to project a future sale price. Prudent underwriting assumes the exit cap rate is equal to or slightly higher than the entry rate, since markets can soften over a multi-year hold. A cap rate calculator makes it easy to test these scenarios: model a conservative exit and see whether the deal still meets your return goals. This disciplined framing keeps buy-and-hold plans grounded in income rather than in optimistic appreciation assumptions that may not materialize.
How to Calculate the Capitalization Rate for a Rental Property
To calculate cap rate for a rental property, work from the bottom of the income statement up. Start with gross annual rent, subtract a realistic vacancy allowance, then subtract operating expenses to arrive at net operating income. Divide that NOI by the purchase price or current value, and multiply by one hundred to express the result as a percentage.
Consider a small rental producing $28,800 in gross annual rent. Apply a 5 percent vacancy allowance of $1,440, which leaves effective gross income of $27,360. Subtract operating expenses of $9,600 for taxes, insurance, management, and maintenance, and you have net operating income of $17,760. If the property is priced at $240,000, the cap rate is $17,760 divided by $240,000, or about 7.4 percent.
The single most common mistake is leaving costs out of NOI. Property management, capital reserves, and a vacancy factor are easy to omit, and each omission inflates the result. A seller's marketing sheet may show a higher number precisely because it skips these line items. Rebuild the statement yourself using conservative figures before you trust any headline percentage.
A cap rate calculator automates this arithmetic and lets you rerun it instantly as you adjust rent, vacancy, or price assumptions. That speed matters when you are screening several properties in a single afternoon and need a consistent method for each one.
Helpful Resources and References for Rental Property Cap Rates
Reliable cap rate analysis depends on reliable inputs, so it pays to know where to source them. For market rent estimates, review active and recently leased listings in the immediate submarket rather than citywide averages. For operating expenses, request the seller's trailing twelve-month statements and utility bills, and cross-check property taxes against the county assessor's public records, which usually list current assessed values and tax amounts.
To benchmark whether a cap rate is reasonable, look at broker market reports published by national commercial real estate firms and at appraisal comparables for similar assets. These sources help you understand the prevailing range for your property type and location, so you can judge whether a listing is priced with the market or against it. Local investor associations and title company sales data are also useful for verifying comparable transaction prices.
Beyond raw data, build your own reference habits. Keep a simple record of every deal you underwrite, including the assumptions you used to calculate the cap rate for each one, so you can compare new opportunities against your own history. Over time this personal dataset becomes more useful than any generic benchmark.
For structural background on how income-property financing fits alongside these numbers, our commercial real estate finance guides walk through related concepts, and a purpose-built cap rate calculator remains the fastest way to standardize the math across every property you review.
Using a Cap Rate Calculator for Commercial Real Estate
Commercial deals reward a more careful approach to the same tool. When you calculate cap rate for a multi-tenant asset, you have to reconcile a rent roll that may include several lease structures, escalation clauses, and reimbursements. Enter stabilized income only after you have accounted for near-term rollover, free rent periods, and any tenant improvement obligations that reduce real cash flow.
The cap rate formula itself stays constant: net operating income divided by value, expressed as a percentage. What changes in commercial analysis is the rigor behind NOI. Include a management fee even if you plan to self-manage, budget capital reserves for roofs and parking lots, and treat non-recurring income, such as a one-time settlement or a below-market legacy lease, with skepticism. These adjustments prevent an inflated cap rate that would not survive due diligence.
A commercial-focused cap rate calculator also helps you test sensitivity. Because value equals NOI divided by the market rate, a half-point shift in the cap rate can change a large building's value by a substantial amount. Modeling a range of rates rather than a single point gives you a clearer picture of downside and upside. This matters most when you are sizing debt, since lenders underwrite to the property's income and a conservative cap rate protects both borrower and lender. Understanding these mechanics before you engage the market puts you in a stronger position to evaluate any deal on its merits.
Getting Faster Access to Commercial Property Financing
Once your analysis suggests a deal works, financing timing often becomes the deciding factor. When you calculate cap rate carefully and present a clean, defensible income statement, you make it far easier for finance providers to evaluate the opportunity quickly. Lenders underwrite to net operating income, so a well-documented NOI, a current rent roll, and realistic expense assumptions reduce back-and-forth and keep the process moving.
Preparation is what speeds things up. Gather trailing operating statements, a T-12, current leases, and a simple summary of the property's income and value before you approach the market. Having these materials ready signals that you understand the asset and shortens the time a lender needs to size a loan against the property's cash flow.
CRE Loans USA is a lead-generation and lender-matching platform, not a lender, so it does not issue loan offers or set rates. What it can do is connect prepared borrowers with independent finance providers whose criteria fit the deal. That matching step works best when your numbers are organized and honest. To understand how the process fits together and whether your scenario is a match, you can continue with the qualification form below and review how CRE loan matching works.
Key Limitations and Drawbacks of Relying on Cap Rates
For all its usefulness, the cap rate is a snapshot, not a full picture. Because it ignores financing entirely, it tells you nothing about your actual cash-on-cash return after debt service. Two investors buying the same property at the same cap rate can experience very different outcomes depending on their loan terms, down payments, and interest rates.
The cap rate calculation is also only as good as its inputs. Optimistic rent projections, understated vacancy, or missing capital reserves can produce a flattering percentage that collapses under real operations. It says nothing about future rent growth, lease expirations, or the capital you will need to inject over the hold, all of which drive true long-term returns.
The metric also breaks down for certain assets. Properties under major renovation, vacant buildings, and development sites have little or no stabilized income, so a cap rate is meaningless or misleading for them. In those cases investors turn to other measures, such as price per square foot, internal rate of return, or discounted cash flow analysis. Treat the cap rate as a fast first filter that tells you which deals deserve deeper study, and never let a single number substitute for full underwriting, market research, and a realistic operating budget.
What a Cap Rate Calculator Does and How to Use It
A cap rate calculator performs one core cap rate calculation, but it does so in a way that makes comparison and scenario testing fast. You enter the property's income and expenses to derive net operating income, enter the price or value, and the tool returns the percentage. Better calculators let you toggle vacancy, expense, and price assumptions so you can see how sensitive the result is to each input.
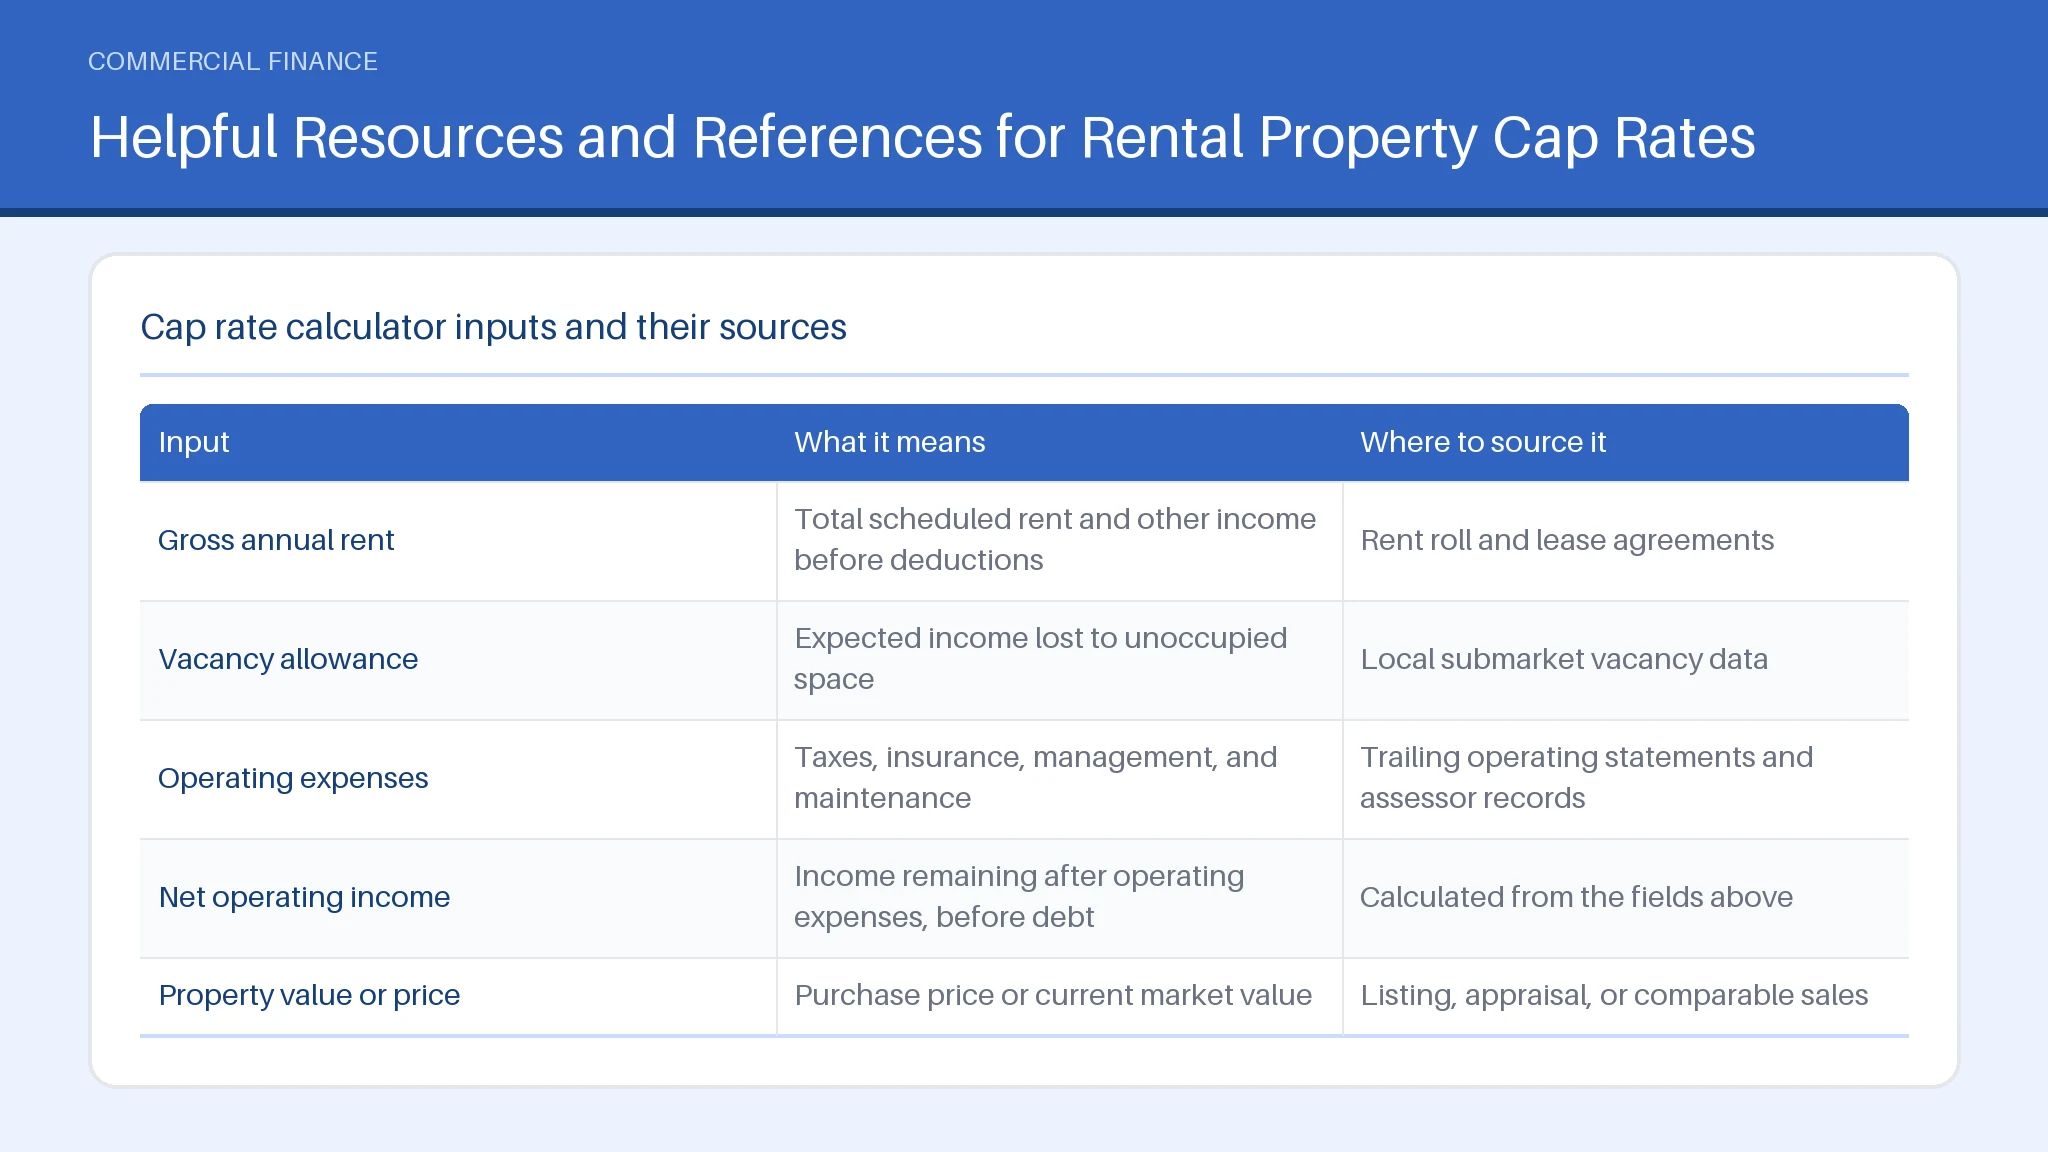
The table below shows the inputs a typical calculator uses, what each one means, and where to source it. Working through these fields in order builds a defensible number rather than a guess.
| Input | What it means | Where to source it |
|---|---|---|
| Gross annual rent | Total scheduled rent and other income before deductions | Rent roll and lease agreements |
| Vacancy allowance | Expected income lost to unoccupied space | Local submarket vacancy data |
| Operating expenses | Taxes, insurance, management, and maintenance | Trailing operating statements and assessor records |
| Net operating income | Income remaining after operating expenses, before debt | Calculated from the fields above |
| Property value or price | Purchase price or current market value | Listing, appraisal, or comparable sales |
Using the earlier example, a net operating income of $17,760 on a $240,000 price yields roughly a 7.4 percent cap rate. Change the vacancy or expense figure and the result shifts immediately, which is exactly why the tool is worth using on every deal you screen.
Summary
Cap rates give property investors a fast, financing-neutral way to compare income properties, but they only work when the inputs are honest and the context is clear. Interpret higher and lower rates against risk, rebuild net operating income yourself, and treat pro forma numbers with caution. Remember that the metric ignores debt and future costs, so it is a first filter rather than a final answer. When your analysis holds up, organized income statements make financing conversations faster. CRE Loans USA is a lender-matching platform, not a lender, and it connects prepared borrowers with independent finance providers whose criteria fit the deal. A practical next step is to run your numbers, then continue with the qualification form below.
Frequently asked questions
How do you calculate the cap rate?
Divide the property's net operating income by its purchase price or current market value, then multiply by one hundred to express the answer as a percentage. Net operating income is your annual rent and other revenue after operating expenses like taxes, insurance, management, and maintenance, but before mortgage payments and income taxes. For example, a property with $17,760 in net operating income and a $240,000 price has a cap rate of about 7.4 percent. Using a cap rate calculator automates this arithmetic and lets you retest instantly as your rent, vacancy, or price assumptions change.
What does a 7.5% cap rate mean?
A 7.5 percent cap rate means the property is expected to generate annual net operating income equal to 7.5 percent of its value, assuming an all-cash purchase. On a $1,000,000 building, that implies $75,000 of net operating income before debt service. Whether that figure is attractive depends on the market and asset type: a 7.5 percent rate might be modest for a higher-risk asset in a secondary market and generous for a stabilized property in a strong metro. Always compare it to prevailing rates for similar properties nearby.
Is 5% a good cap rate?
It depends entirely on context. A 5 percent cap rate is common and often considered good for stabilized, lower-risk properties in strong, high-demand markets where buyers accept lower yields in exchange for stability and appreciation potential. For a higher-risk asset or a weaker market, 5 percent may be too low to compensate for the risk. Judge it against comparable sales and your own return targets rather than treating any single number as universally good or bad.
What is a 4% cap rate?
A 4 percent cap rate means annual net operating income equals 4 percent of the property's value, a relatively low yield that usually signals a premium, low-risk asset in a top-tier market. Investors accept these lower rates when they expect strong appreciation, reliable tenants, or exceptional location to make up for the modest current income. Because such deals leave little margin for error, run the cap rate calculation with conservative assumptions and confirm the income is in-place rather than projected before committing.